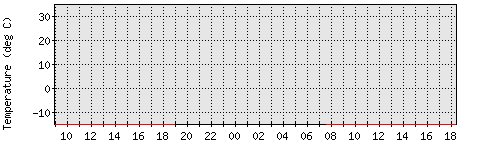
Altendorf Weather: Temperature
The
red
curve shows the temperature, the
light red
area shows the range between maximum and minimum temperature during the sampling interval. The
blue
curve shows the dew point, the temperature at which dew begins to form.